Carousel template for engineering posts: the 7-slide structure that works
A free, slide-by-slide template for turning an engineering blog post, postmortem or architecture write-up into a LinkedIn carousel. Each slide has one job, a headline pattern and the visual that fits it, shown on a real carousel made from Stripe's post on online migrations.
The template at a glance
Most carousel templates are built for tips and listicles. Engineering posts need a different shape: the reader has to understand how a system works before the fix makes sense, and the diagram does most of the explaining. This structure tells one story across seven slides, and each slide answers the question the previous one raised.
| Slide | Its job | Visual |
|---|---|---|
| 1. The hook | Name the company or system and say what happened, in plain words. Promise the answer the deck delivers. | A cover illustration or the one number that matters, plus 2 or 3 fact chips. |
| 2. The setup | Show how the system works on a normal day, before anything breaks or changes. Readers can't follow a fix to a system they've never seen. | A simple diagram of the parts and what moves between them. |
| 3. The problem | Say what made this hard: the constraint, the failure, or the number that forced a change. | A big number, a short list of constraints, or a chart of the symptom. |
| 4. The mechanism, step 1 | Start the explanation. One idea per slide: the first move the team made, and why it works. | A flow or numbered steps that follow one concrete thing through the system. |
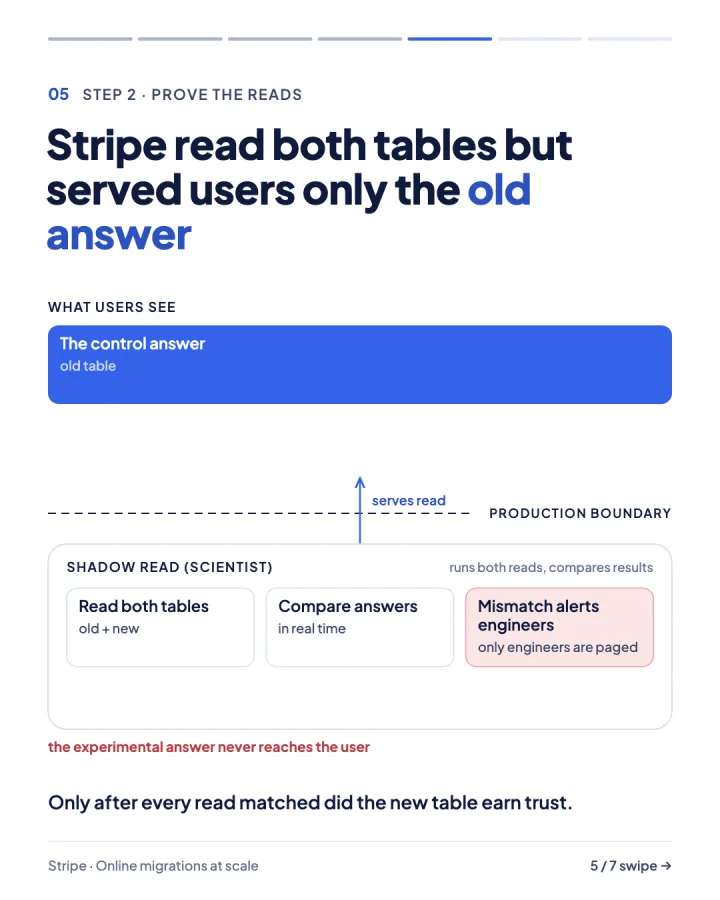
| 5. The mechanism, step 2 | The clever part: the step that makes the approach safe, fast or correct. | A diagram where the important path is visibly different from the rest (highlighted, or marked as not reaching users). |
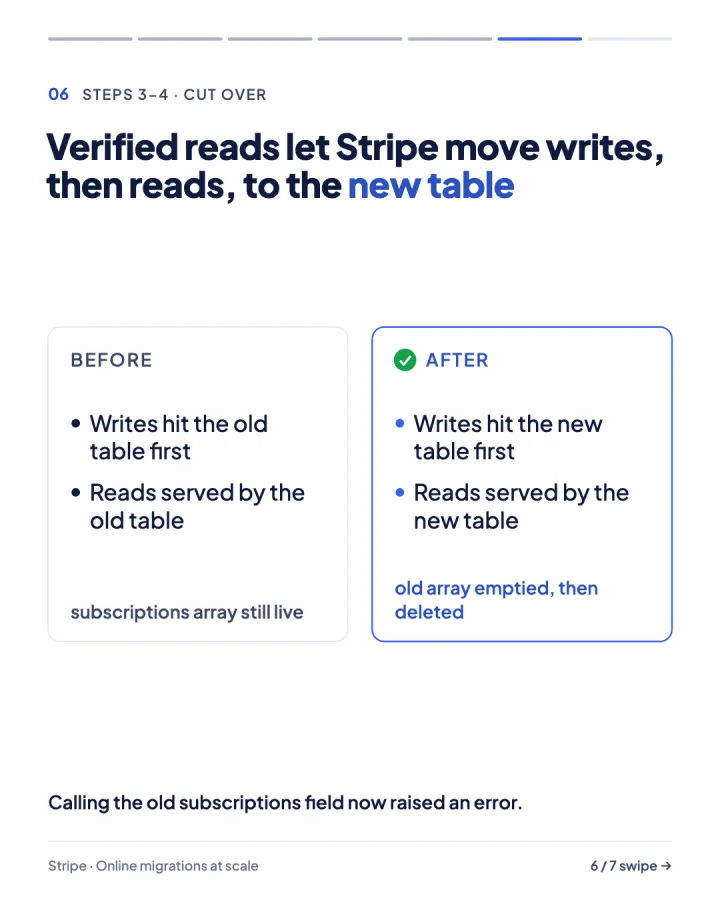
| 6. The result | Show what changed: before and after, the measured outcome, or the switch itself. | Before and after side by side, or the headline numbers. |
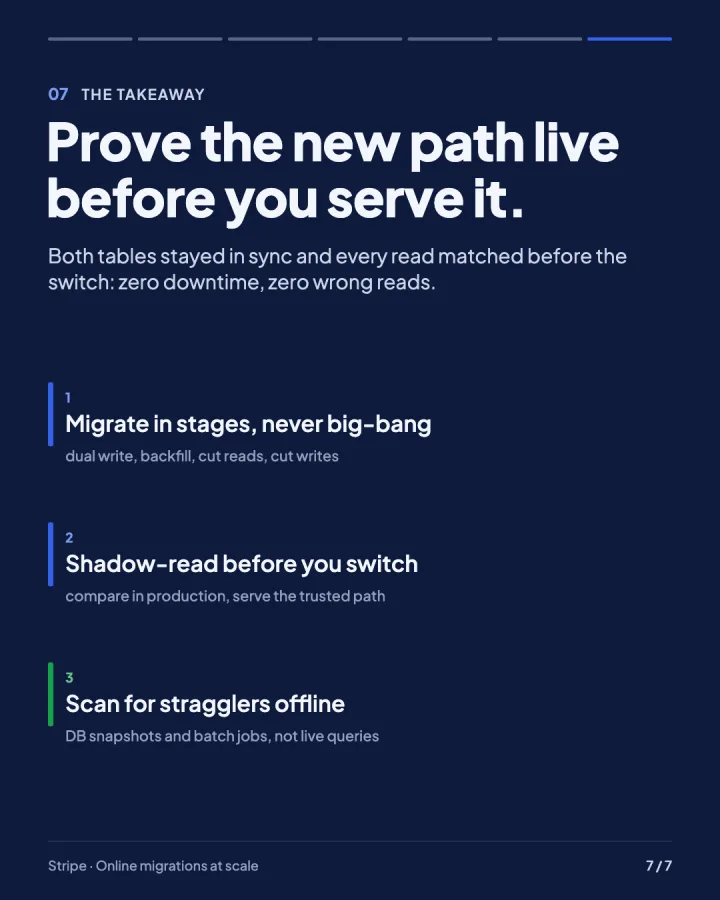
| 7. The takeaway | Answer the question slide 1 raised in one line, then give two or three lessons the reader can use. | Two or three numbered lessons, each with a short line of detail. |
Slide by slide, with a real example
The example follows one thing, a single subscription, through the whole story. Picking one concrete thing to follow (a request, a row, a deploy) is the easiest way to keep seven slides connected.
The hook
Name the company or system and say what happened, in plain words. Promise the answer the deck delivers.
- Headline pattern
- [Company] [did something surprising]. [The result that makes it hard to believe].
- Visual
- A cover illustration or the one number that matters, plus 2 or 3 fact chips.
- In the example
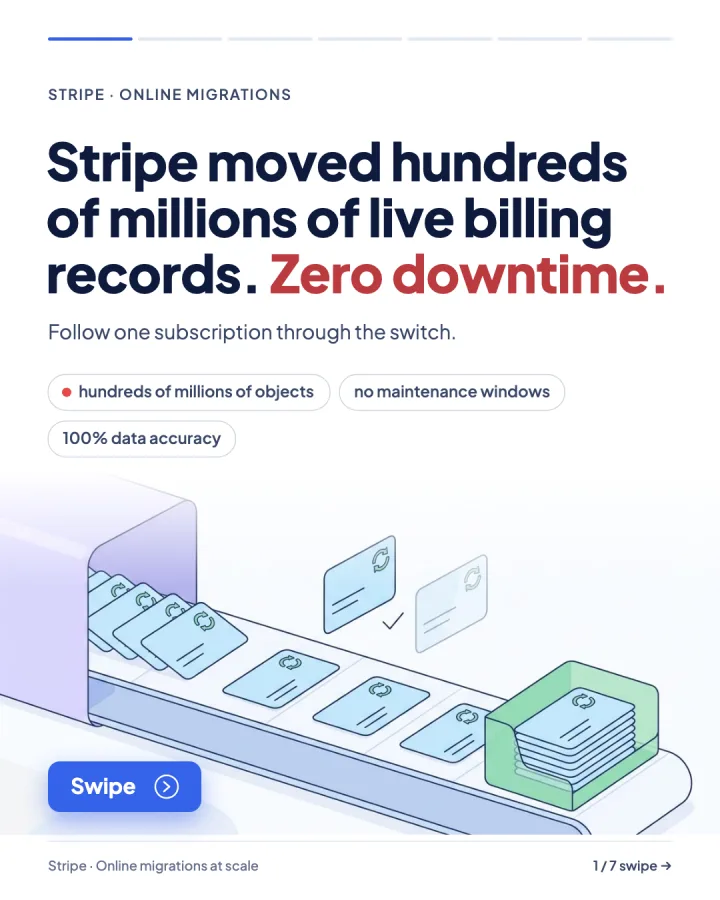
- "Stripe moved hundreds of millions of live billing records. Zero downtime." Three chips back it up, and one line tells the reader what to follow: "Follow one subscription through the switch."
- Avoid
- A teaser question with no subject ("Ever wondered how databases scale?"). The reader scrolls past.
The setup
Show how the system works on a normal day, before anything breaks or changes. Readers can't follow a fix to a system they've never seen.
- Headline pattern
- [The system] [works like this], so [the consequence that sets up the problem].
- Visual
- A simple diagram of the parts and what moves between them.
- In the example
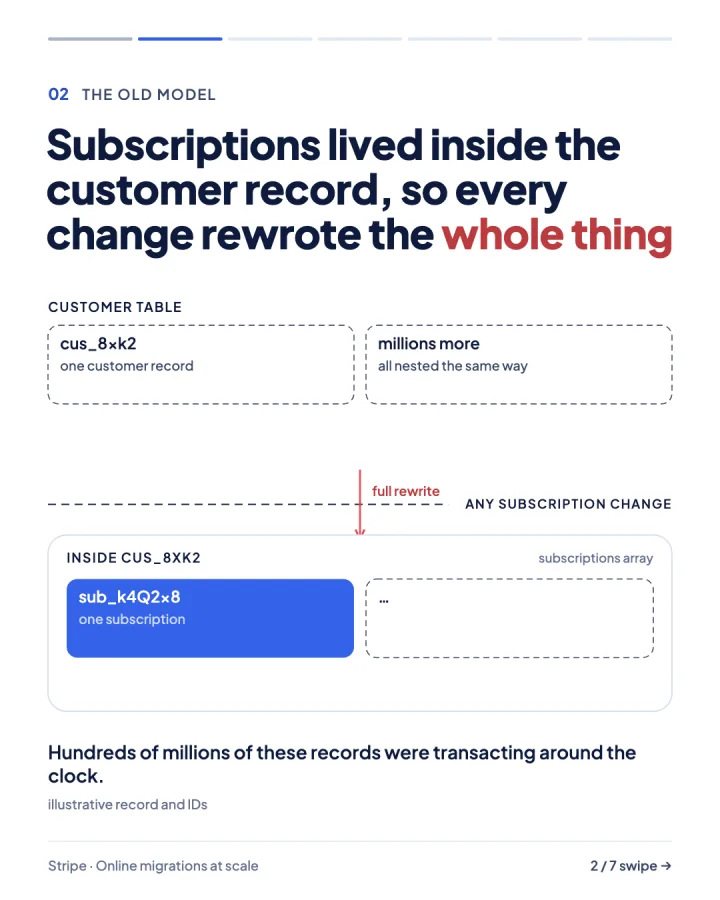
- "Subscriptions lived inside the customer record, so every change rewrote the whole thing", with a diagram of a customer record holding its subscriptions.
- Avoid
- Skipping straight to the fix. Without the setup, the clever part reads as jargon.
The problem
Say what made this hard: the constraint, the failure, or the number that forced a change.
- Headline pattern
- [Why the obvious fix was impossible], and [what was at stake].
- Visual
- A big number, a short list of constraints, or a chart of the symptom.
- In the example
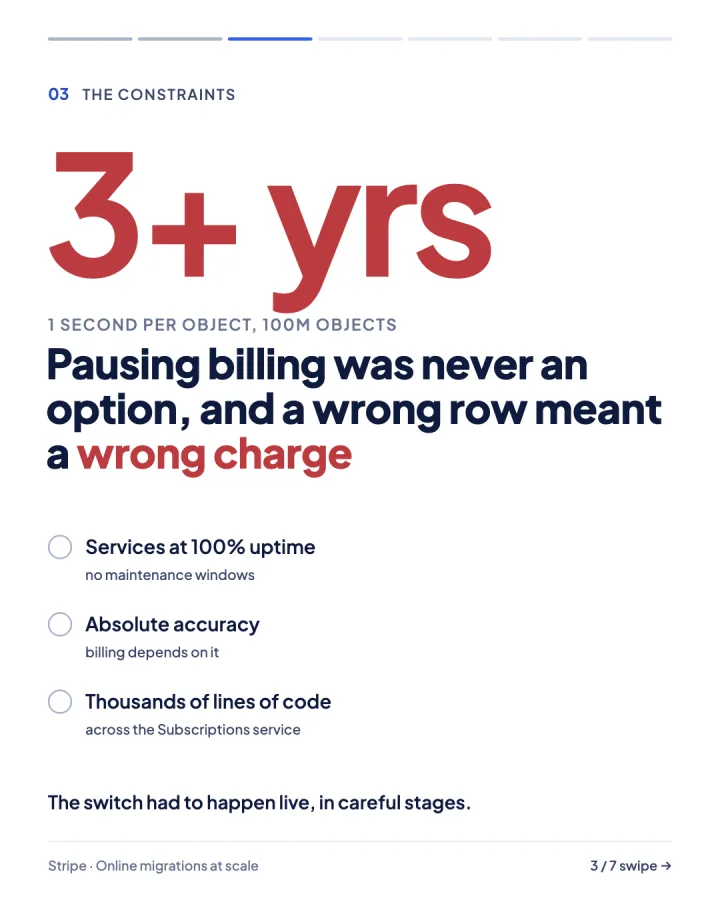
- "Pausing billing was never an option, and a wrong row meant a wrong charge", under a large "3+ yrs" and three constraints.
- Avoid
- Stating the problem without the stakes. Say what users would have seen or lost.
The mechanism, step 1
Start the explanation. One idea per slide: the first move the team made, and why it works.
- Headline pattern
- [The team] [did the first step], then [the next part].
- Visual
- A flow or numbered steps that follow one concrete thing through the system.
- In the example
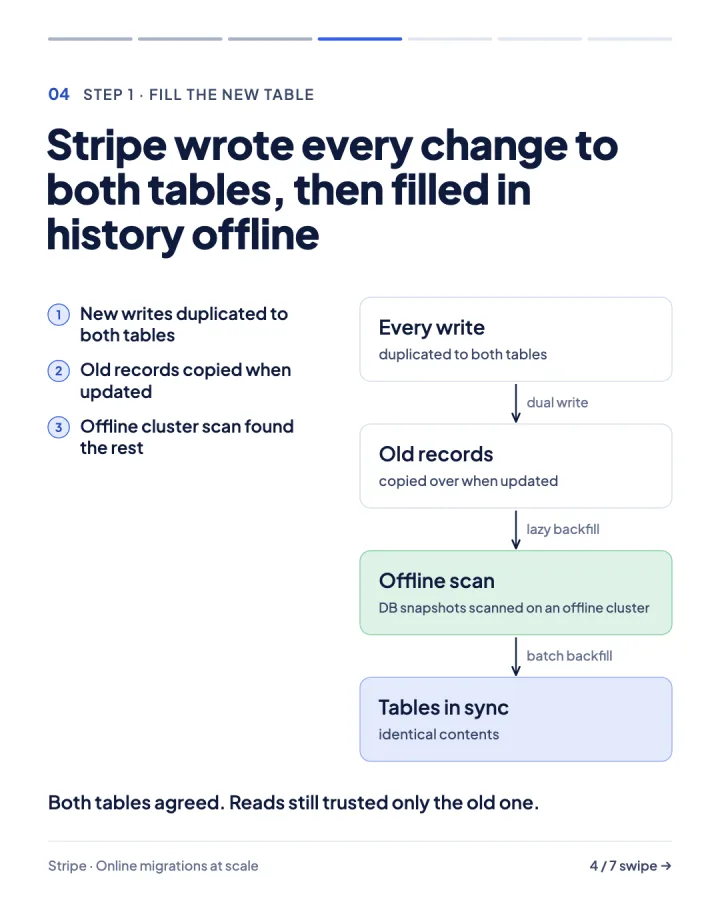
- "Stripe wrote every change to both tables, then filled in history offline", as a three-step flow.
- Avoid
- Cramming the whole architecture onto one slide. Split it.
The mechanism, step 2
The clever part: the step that makes the approach safe, fast or correct.
- Headline pattern
- [The team] [did the clever thing] but [the safeguard].
- Visual
- A diagram where the important path is visibly different from the rest (highlighted, or marked as not reaching users).
- In the example
- "Stripe read both tables but served users only the old answer", with the shadow read drawn below a production boundary it never crosses.
- Avoid
- Describing the clever part in words only. This is the slide people screenshot, so draw it.
The result
Show what changed: before and after, the measured outcome, or the switch itself.
- Headline pattern
- [What the team could now do], [the outcome in numbers if the article gives them].
- Visual
- Before and after side by side, or the headline numbers.
- In the example
- "Verified reads let Stripe move writes, then reads, to the new table", as a before and after.
- Avoid
- Numbers the article doesn't state, and dropped qualifiers ("35x" when the post says "up to 35x").
The takeaway
Answer the question slide 1 raised in one line, then give two or three lessons the reader can use.
- Headline pattern
- [The principle, in one sentence].
- Visual
- Two or three numbered lessons, each with a short line of detail.
- In the example
- "Prove the new path live before you serve it", then three lessons: migrate in stages, shadow-read before you switch, scan for stragglers offline.
- Avoid
- Generic advice ("Communication is key"). The lesson should only make sense after this story.
Copy the template
Paste this into your notes or design tool and fill in the brackets from the article. Write all seven headlines first: read on their own, in order, they should tell the whole story.
SLIDE 1 · HOOK
Headline: [Company] [did something surprising]. [The result that makes it hard to believe].
Subtitle: Follow [one concrete thing] through [the system / the incident].
Chips: [number from the article] · [number] · [number]

SLIDE 2 · SETUP
Headline: [The system] [works like this], so [the consequence that sets up the problem].
Visual: the parts of the system and what moves between them.

SLIDE 3 · PROBLEM
Headline: [Why the obvious fix was impossible], and [what was at stake].
Visual: the big number, the constraints, or the symptom users saw.

SLIDE 4 · MECHANISM, STEP 1
Headline: [The team] [did the first step], then [the next part].
Visual: a flow that follows one concrete thing.

SLIDE 5 · MECHANISM, STEP 2
Headline: [The team] [did the clever thing] but [the safeguard].
Visual: the important path drawn differently from the rest.

SLIDE 6 · RESULT
Headline: [What the team could now do], [the outcome, with the article's own qualifiers].
Visual: before and after, or the headline numbers.

SLIDE 7 · TAKEAWAY
Headline: [The principle, in one sentence].
1. [Lesson]: [one line of detail]
2. [Lesson]: [one line of detail]
3. [Lesson]: [one line of detail]

Footer on every slide: [Company] · [Article title]
In the post: a link to the original article.
Versions for incidents, migrations and performance posts
The seven jobs stay the same; what fills them changes with the kind of post.
Incident or postmortem
Hook with the impact (what broke, for how long). Setup: how the system normally works. Problem: the symptom users saw. Mechanism: the root cause, then the response. Result: what changed after. Takeaway: the lesson other teams can apply.
- 1Hook
- 2Setup
- 3Symptom
- 4Root cause
- 5Response
- 6What changed
- 7Lesson
Migration or architecture change
Hook with the scale and the constraint ("zero downtime"). Setup: the old design. Problem: why it had to change. Mechanism: the migration steps, one or two per slide. Result: the cutover. Takeaway: the pattern.
- 1Hook
- 2Old design
- 3Why change
- 4Step 1
- 5Step 2
- 6Cutover
- 7Pattern
Performance or scaling win
Hook with the result and the surprise in it. Setup: where the time or cost went. Problem: the bottleneck, measured. Mechanism: the change. Result: the numbers, with the article's own qualifiers. Takeaway: how to find the same bottleneck.
- 1Hook
- 2Setup
- 3Bottleneck
- 4The fix
- 5Why it works
- 6Result
- 7Lesson
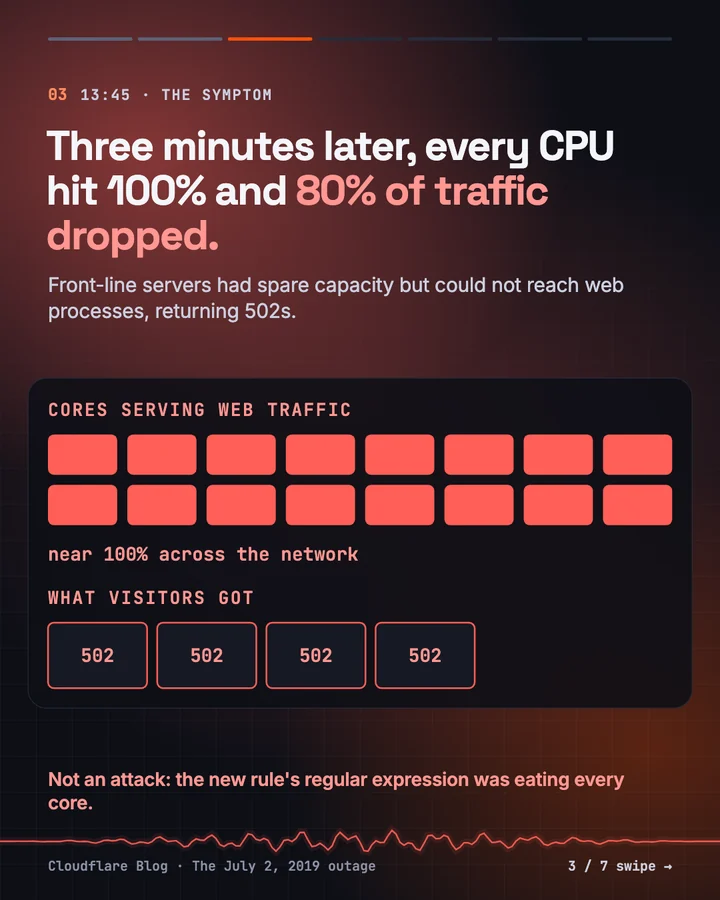
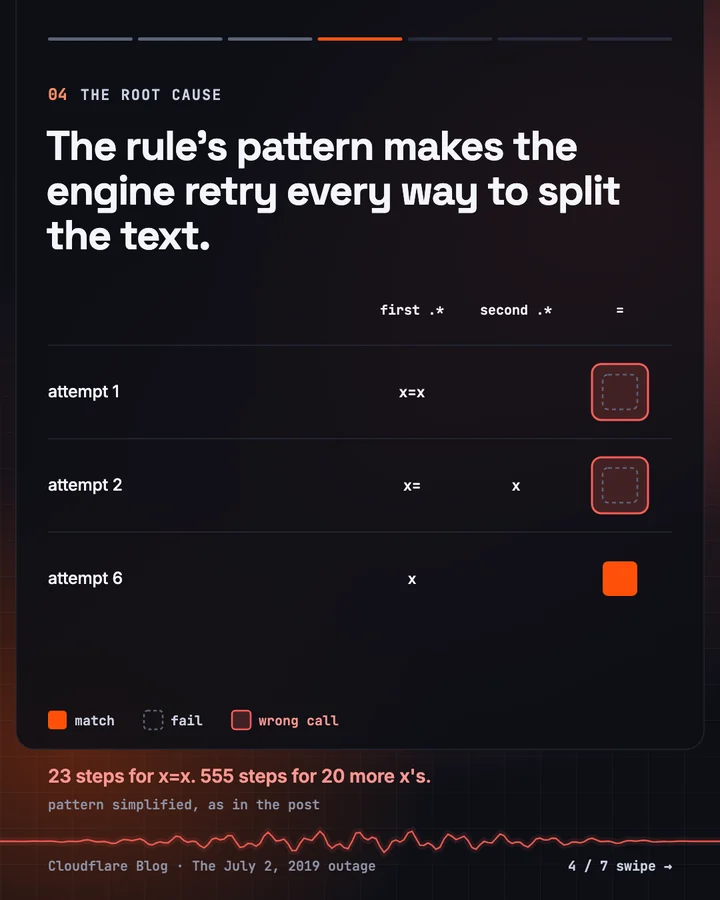
An incident carousel made with the first version, from Cloudflare's write-up of its July 2019 outage:


Size, text and design rules
- Size: 1080 × 1350 pixels, a 4:5 portrait. It fills the most screen on a phone.
- Format: export one PDF and post it as a LinkedIn document; each page becomes a slide.
- Words: about 32 words of headline, subtitle and caption per slide, and under 65 in total including diagram labels.
- Headlines: complete sentences that say who did what. At most one question in the whole deck.
- Text size: nothing smaller than about 22 pixels on a 1080-pixel-wide slide. Check it on your phone before posting.
- Diagrams: one idea per diagram. An arrow means something moves along it, so label what. Work that runs in parallel isn't drawn as one more step in a chain.
- Jargon: explain a term where it first appears, or describe it by what it does. Keep a company's internal names to one or two.
- Credit: the company and article title in the footer of every slide.
Accuracy checklist before you post
Engineers will spot a wrong detail in seconds, and a confident mistake about someone else's system is the fastest way to lose them. Most errors in technical carousels aren't wrong numbers; they're right numbers with the wrong words around them.
- Every number is in the articleSearch the post for each figure on your slides. If you rounded or derived one, say so.
- Qualifiers survive"Up to 35x", "about", "by default", "in internal benchmarks": if the article hedges a number, your slide does too.
- Tense matchesIs it shipped, being rolled out, or planned? "Migrated" and "is migrating" are different claims.
- The right subject"Billions of agent commits" is wrong if the article counts developers and agents together.
- The mechanism is rightA push moves a branch to a new commit; the branch name doesn't change. Have someone who knows the system read the mechanism slides.
- No word stronger than the source"Never", "always", "stateless", "instant": each needs the article to say it.
- Examples are labelledA made-up request ID or timestamp gets a small "illustrative" note where it first appears.
- Quotes are word for wordAnd attributed to the person the article names.
- The source is creditedName the company and article on every slide (a footer line works) and link it in the post.
FAQ
How many slides should an engineering carousel have?
Seven is a good default: a hook, a setup, the problem, two slides of mechanism, the result and a takeaway. Fewer and the mechanism gets crammed; many more and readers drop off before the payoff.
What size should LinkedIn carousel slides be?
1080 × 1350 pixels (a 4:5 portrait) fills the most screen on a phone, where most people read LinkedIn. Export the slides as one PDF and upload it as a document post; LinkedIn shows each page as a slide.
How much text should go on each slide?
Keep the headline, subtitle and caption to about 32 words, and everything a reader reads on the slide, labels included, under about 65. The diagram should carry the explanation.
Can I make a carousel about another company's engineering post?
Yes, as commentary that credits them: name the company and article on the slides and link the original in your post. Use their facts and quotes exactly, and don't present their work as yours.
Is this template free?
Yes. Copy the outline and use it in any design tool. If you'd rather not build the slides yourself, Chartin turns a link to an engineering article into a carousel that follows this structure, and your first one is free.
What makes a good hook slide for a technical post?
Name the company or system and say what happened in plain words, then add the one number that makes it surprising. A headline that works on its own beats a question.
Skip the template
Chartin follows this structure for you. Paste a link to an engineering article: it reads the whole post, lets you pick the story and the audience, draws the diagrams from the article's facts, tests the slides on a reader who never saw the article, and checks every line against the source before you see it. See carousels it has made, or how it compares with other carousel makers.
Make this carousel from a link
Paste a link to an engineering post. Your first carousel is free, no card needed.
Make a carousel